US Debt Watch
Based on 11,032 Treasury auction results
Source: US Treasury auction results · Source code on GitHub
Source: US Treasury auction results · Source code on GitHub
Methodology & data sources
Auction results
The US Treasury issues debt by selling bills, notes, and bonds at auctions. The results are published here. Opening the "Competitive Results PDF" for a given security shows something like this:
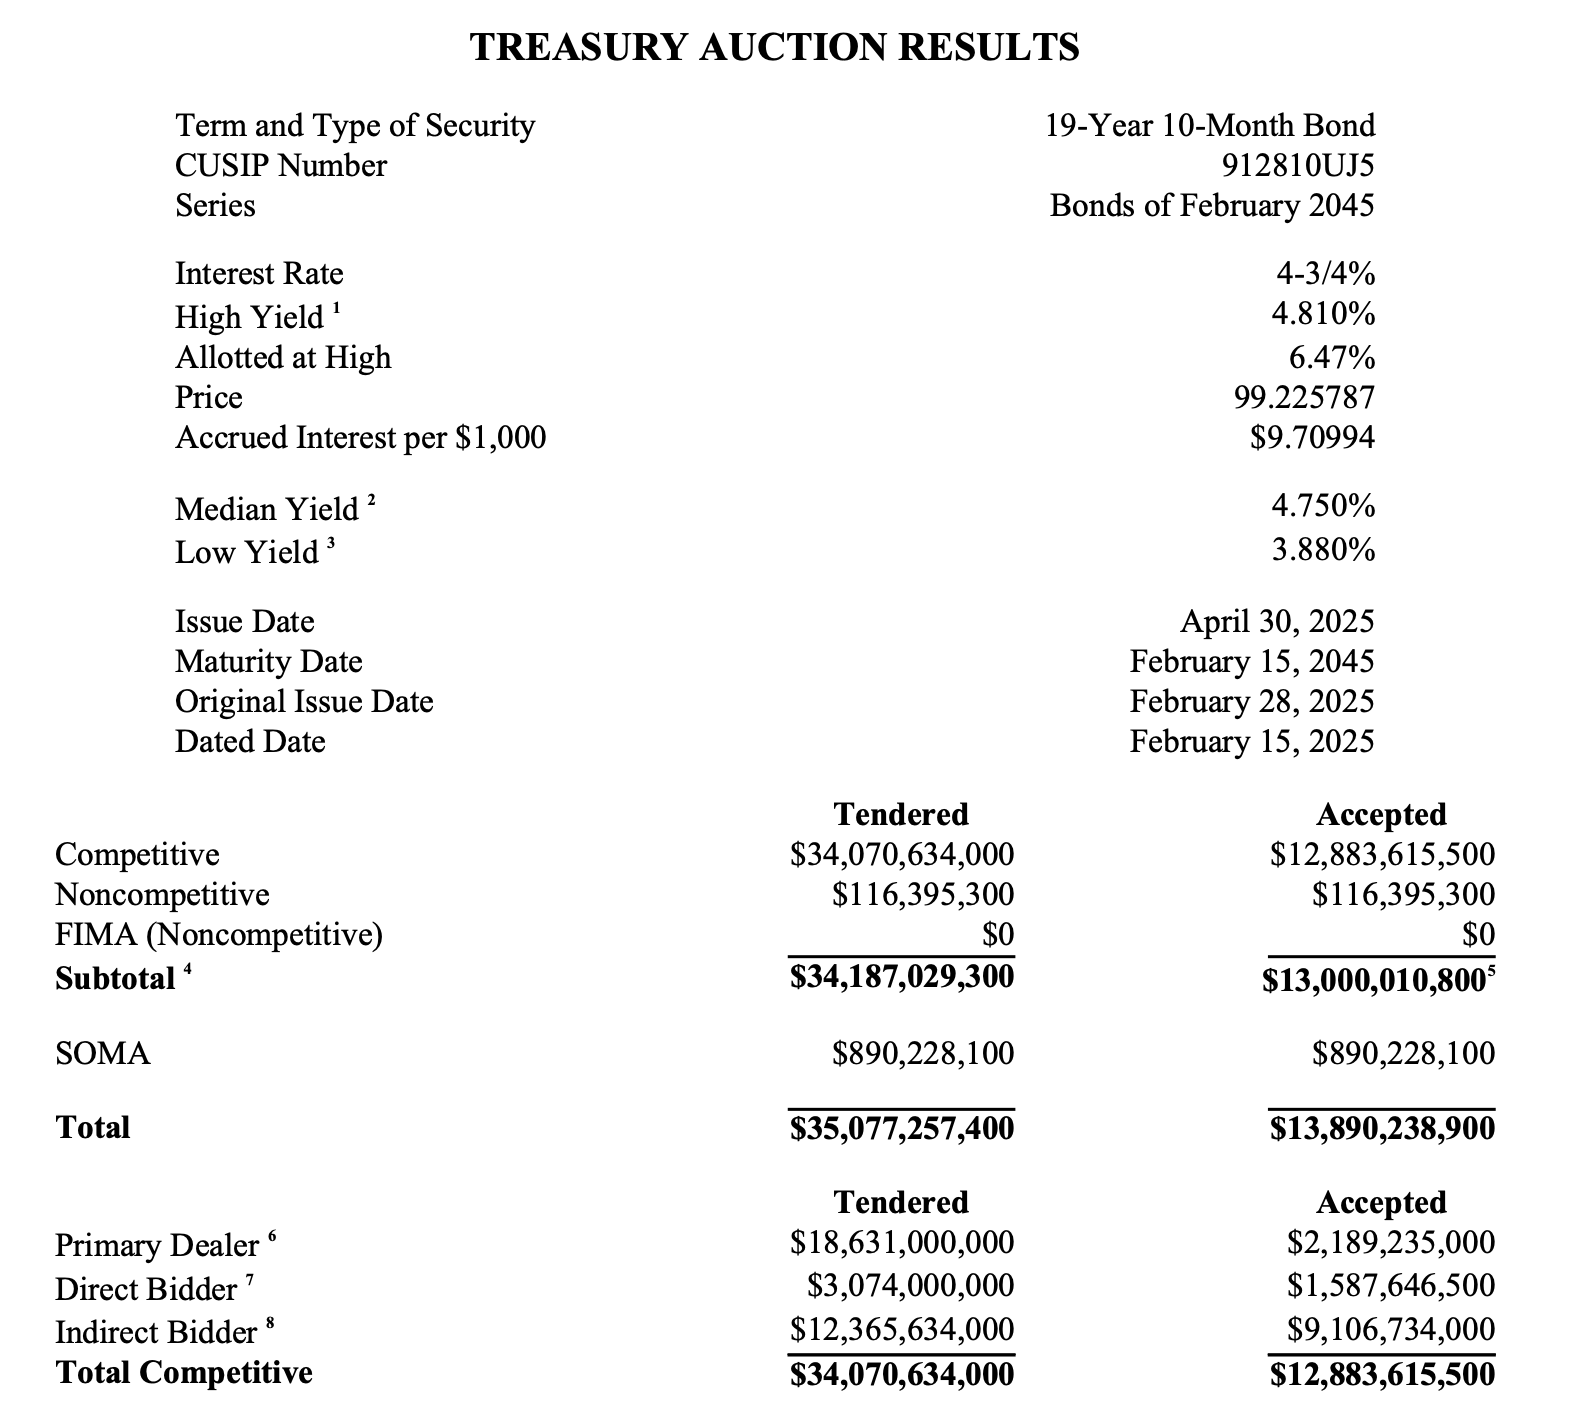
Each auction result includes several important details:
- The term: 19-Year 10-Month. It's fractional because this is the same batch of bonds reopened and sold 2 months after the original issue. This distinction matters for how we classify bonds by term.
- Issue Date: the date the money is loaned to the Treasury.
- Maturity Date: the date the money is repaid. We use the gap between this and the Issue Date as the effective term.
- The interest rate: 4.75%.
- The price of a $100 bond, here $99.22, set by the auction participants. The bonds are sold through a Dutch auction. Paying $99.22 for a bond that pays 4.75% on its $100 face value and repays the full $100 at maturity means the buyer earns slightly more than the coupon: the $0.78 discount is extra return on top of the interest, so the effective high yield is 4.810%, a bit above the 4.75% coupon rate.
- In the Accepted column, the Total is the amount of debt actually sold. This is the number that matters for us.
- The Tendered column shows all the bids submitted, which we don't track. Note that the Noncompetitive and SOMA line items are filled in full (Tendered == Accepted).
The full auction results are also available programmatically at fiscaldata.treasury.gov. We use this API to download every auction result. (see download.py creating ./data)
Bond terms
The following show the distribution of bond terms (the time from issue to maturity)
Based on this distribution, we bin securities into four term categories:
- ≤ 6 months: short-term Treasury bills (4, 8, 13, and 26-week bills).
- 1 - 3 years: 52-week bills and 2 and 3-year notes.
- 4 - 7 years: 4, 5, and 7-year notes.
- 10 - 30 years: 10-year notes and 20 and 30-year bonds.
Chart 1: The aggregated debt
To turn individual auctions into the debt-over-time chart, we treat each security's Total Accepted amount as outstanding on every day between its Issue Date and Maturity Date. For a given day, the total debt is simply the sum of every security whose life span covers that day, split into the four term brackets described above.
Chart 2: The cost of the interest on the debt
The interest cost is computed the same way as above, but instead of adding the face amount we add amount × rate (the annual coupon), where rate is the security's interest rate for notes and bonds, or its high investment rate for bills. TIPS are handled separately because their coupon is paid on an inflation-adjusted principal, so we scale their interest by the Treasury reference-CPI index ratio on each date.
Chart 3: Interest rate at issuance
The third chart shows the interest rate the Treasury pays on newly issued debt, per term bracket. Since a week can issue securities of different sizes, we compute an amount-weighted average of their rates, so a $50B issue counts five times as much as a $10B one:
rate = Σ(amountᵢ × rateᵢ) / Σ(amountᵢ)
A single week's issuance is noisy, since each week mixes securities of different maturities and reopenings that carry old coupons. To smooth this out, the weighted average above is taken over every security issued in a trailing window, not just the current week. The window length is per bracket, because short-term bills are auctioned very often while 20 and 30-year bonds are issued rarely; a longer window fills the gaps between those infrequent auctions:
- ≤ 6 months: 8-week window.
- 1 - 3 years: 13-week window.
- 4 - 7 years: 21-week window.
- 10 - 30 years: 26-week window.
We overlay the federal funds rate for comparison.
Source code
All of the code and data used to produce these results are available on GitHub:
download.py, data/, compile.py, results.json.